For those expecting insights about sugar-coated chocolate, apologies for the disappointment. In financial advisory circles, we call those colourful asset class performance tables “smartie boxes.” Here’s the latest from Investec using Morningstar data, showing 18 years of SA rand performance to 2025.
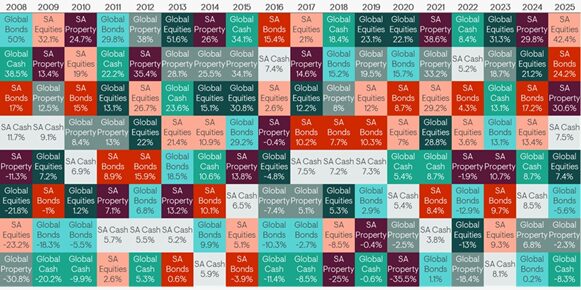
I’ve spent many long afternoons trying to see patterns in these tables, but with no clear conclusion. More recently, my past life as an accountant kicks in whenever I see such data, driving me to calculate averages and analyse it thoroughly to extract meaningful insights. Here are the results of that analysis, using only the last ten years.
Ten-Year Average Performance (2016-2025)
- Global equities: 13.4%
- SA equities: 13.2%
- SA bonds: 11.6%
- SA cash: 6.8%
- Global or SA property: 6.1%
At first glance, if you can tolerate the volatility of global equities, that’s where you should invest, although the negative 4.8% return in 2016 may have discouraged you. It’s worth noting that global bonds delivered an average return of only 1.7% over this period, significantly underperforming all other major asset classes.
The SA equity performance includes the exceptional 42.4% return in 2025, driven almost exclusively by gold miners and the weaker US dollar. This can be considered an outlier. Without 2025, SA equities delivered an average return of 10% over the preceding nine years. However, to keep the analysis pure, no adjustments have been made to the figures presented.
Portfolio Construction Options
My first analysis assumed equal distribution across all eight asset classes. As expected, including the bottom three performers significantly impacts returns, achieving only 7.3% on average over the ten years.
Let’s consider how traditional portfolio structures performed over this period:
- Traditional 60/40 portfolio (global assets): 8.7%
- Traditional 60/40 portfolio (SA assets): 12.6%
- Traditional 60/40 portfolio (blended global and SA assets): 10.6%
The underperformance of global bonds delivers a significant blow to the offshore 60/40 portfolio, whereas the exceptionally high SA equities return achieved in 2025 boosted the SA-focused 60/40 portfolio substantially.
The Surprising Power of Momentum
Here’s where the analysis becomes particularly interesting. In theory, the best risk-adjusted return would be achieved if you had sufficient foresight to invest equally across the top five asset classes in each year. Such a selection would have delivered 13.5% per annum over the ten years.
But what if you have no faith in your ability to predict future returns? What happens if you simply construct a portfolio using the previous year’s top five asset classes?
Over the ten years from 2016 to 2025, such a momentum-based portfolio would have delivered an astonishing 15% per annum.
This figure includes a contribution from 2015, when the top five asset classes achieved an incredible 28.4% return. Note that the rand fell nearly 34% in 2015, highlighting how currency movements can dramatically impact returns for South African investors.
The Rearview Mirror Approach
Accountants are often criticised for only ever looking in the rearview mirror, and this criticism certainly applies to this exercise. However, the results suggest something worth considering: if you’re not trained in macroeconomics and don’t have time to evaluate probable future scenarios, a momentum strategy that follows the best performers—even if you’re a full year behind—appears to deliver surprisingly strong results.
Important Considerations
Before implementing any strategy based on this analysis, consider the following:
Past performance is not indicative of future results. The period analysed includes unique events such as the 2025 SA equity surge and the 2015 rand depreciation, which may not repeat.
Volatility matters. These returns don’t reflect the stomach-churning volatility you would have experienced along the way. The momentum strategy would have required significant rebalancing and tolerance for dramatic swings.
Tax implications. For South African investors, frequent rebalancing can trigger capital gains tax events, potentially eroding the benefits of a momentum approach.
Implementation costs. Transaction costs and the practical challenges of rebalancing across multiple asset classes can impact real-world returns.
The Bottom Line
While this analysis is firmly rooted in historical data, it reveals an intriguing pattern: systematic momentum strategies, even with a one-year lag, may offer competitive returns for investors who lack the time or expertise for detailed macroeconomic forecasting. Whether this represents a genuine edge or simply a quirk of this particular ten-year period remains an open question—one that only time will answer.
As always, consult with a qualified financial advisor to determine the most appropriate strategy for your individual circumstances, risk tolerance, and investment goals.
Author: Peter Harris- Wealth Manager (Parity Wealth Managers)
Disclaimer: This article is for informational purposes only and does not constitute financial advice. Past performance does not guarantee future results.